zThe first article in a collaborative series with Charity Digital.
Data analytics has a certain reputation. It is perceived as a difficult field, requiring specialist knowledge and an in-depth understanding of mathematics. That reputation is simply wrong. Applying data analytics is surprisingly easy – and exceptionally rewarding
Data analytics is simply the act of deriving insights from information. The insights that you derive can be hugely beneficial to your organization by supporting the decision-making process, increasing efficiency, improving outcomes, and helping with long-term strategy.
Data analytics is an art of extraction, taking meaning from information and using it to your advantage. The extraction does not require experts. It does not even require technical expertise. Data analytics can be a simple and cost-efficient practice anyone can learn. All it requires is the will of an organization and compliance with any and all applicable laws and regulations.
And we are here to help! Below we will explore the key benefits of data analytics and look at some of the essential tools that you can use. We will then offer a brief step-by-step guide to mastering analytics, giving you the confidence to start your data analytics journey.
Key benefits of data analytics
There are so many benefits to data analytics. The list is ever-expanding, as new developments emerge and platforms offer novel functionalities. Below we list some of the most important benefits that will allow your organization to thrive.
Connecting with supporters
A key benefit of data analysis is a deeper understanding of your supporters. This, in turn, will ensure that your organization is reaching the right supporters, at the right time, with the right message. Data analysis gives you information about potential supporters or customers, which you can use to optimize your marketing and communications. So instead of sending emails without a specific plan, for example, data analysis allows you to fine-tune, perfect, and optimize communications.
Developing long-term strategy
Probably the most important and wide-reaching benefit of data analytics is the ability to think long-term. Organizations should make decisions with an eye to the future, considering patterns and trends, potential resources and capability. Data analytics helps with that preparedness, as you can examine finances, budgeting, and many other areas of your organization to ensure that you make the right decisions for long-term sustainability.
Supporting risk analysis
Finding meaning in data can help with risk analysis. Predictive data analytics could help you identify future issues, such as declining clicks on donations buttons or potential shortages of resources. Exploratory data analysis allows you to examine wider trends that could negatively affect your organization. Simply put, data analysis helps with preparedness and preparedness generally helps to mitigate risk.
Finding strengths and weaknesses
Data analysis helps you to see what you have done well and the areas that have room for improvement. Closer analysis can draw detailed insights, giving you clues as to why things went right or wrong. Broader analysis can help you scope out larger trends, which could inform future decisions. Data analysis can also help you identify blind spots, such as certain areas where you may need to invest more resources, more time, and so on.
Essential tools for data analytics
Before we explore how to master data analytics, it’s important to know what tools you need to get started. It is likely that you already have some knowledge of these tools, even if you haven’t dived into the analytics arena. They are all intuitive and easy to learn.
Google Analytics (GA) is perhaps the most popular tool for website analytics. GA offers simple functionality at little or no cost. There are several other web tools, such as Adobe Analytics and Open Web Analytics, many of which are simple to navigate and completely free.
Email platforms, such as MailChimp, DotDigital, and GetResponse, all have various analytics options, which again are cost-effective and easy-to-use. Similarly, most social media platforms offer analytics tools, including Facebook, Twitter, and LinkedIn.
Most visual and audio platforms also have options for analytics, including YouTube and Audioboom, although these are sometimes limited. And old classic software, such as Microsoft Excel and Google Sheets, can prove useful when analyzing, summarizing, and presenting raw data.
It is important that you use the tools that generate the most relevant data for your organization’s needs. Pick the platforms that you use regularly and uncover the data that you can effectively extract meaning from.
As you discover what your data analytics needs and goals, ensure the tools you select, the data they collect, and the methods with which you employ them, are appropriate to your organization’s policies. Also, ensure that you follow any applicable data processing laws and regulations and the terms and conditions of the tools themselves.
Simple steps for mastering data analytics
Starting with data analysis is simple. It’s so simple, in fact, that you can do it right now using the above platforms.
We recommend starting small with so-called “low hanging fruit”. Explore a question to which you have relevant data easily at hand, a question that can make an immediate impact on your organization. Having some early successes can not only help you achieve your desired organizational outcomes, but it will build confidence and comfort in the analytics framework and help you to continue to grow and perfect your use of analytics.
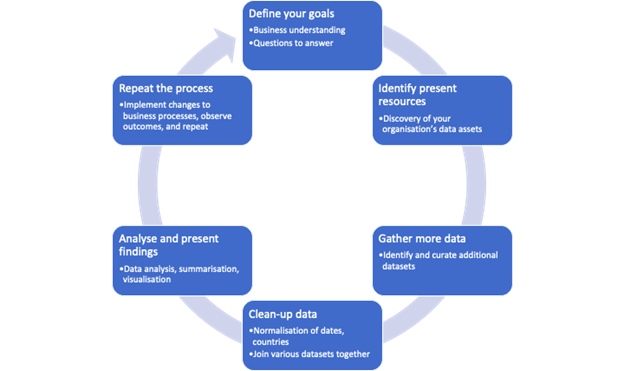
Here are six simple steps to help you get started.
- Define your goals
This is the most important step. Before you effectively analyze data, you need to know what you are hoping to achieve. To define your goals, ask yourselves questions and brainstorm. Your goals should be specific, measurable, realistic, and defined by time. Once you’ve established your goals, you can start to look at data with a greater sense of purpose.
- Identify present resources
Look at your present resources. It’s likely that you have loads of data that you have not been using which may support the goal you identified in step 1. It’s important to understand each resource. You should check, for example, the source of the data, the purposes for which you can use it, any data processing laws that it may be subject to, and so on. Starting with a solid foundation of information that conforms with applicable data protection laws ensures a more reliable process and outcome. Look at all the tools mentioned above – web analytics, email platforms, social media, and so on – and see what data is legally and ethically available to use.
- Gather more data
Some data will be useful, other data will not. You can start to sift through and examine your raw data with reference to your goal. You may notice that something is missing. So, gather more data. There are lots of methods to expand your data resources, but again, to ensure you are adding value without increasing risk, conform to your organization’s policies and data protection laws. You could, for example, email people outside your company for more qualitative data, use questionnaires and surveys, or reach out to consenting service users for further information. But you should always be aware of the required consents to undertake any of these actions.
- Clean up data
Once you’ve got all your data, it’s time for spring cleaning. You can use spreadsheets to arrange data, such as Microsoft Excel or Google Sheets, or you could invest in a high-quality CRM system to delve even deeper. Start identifying the information you need to meet your objective and remove needless data. Data is only effective when easy to read. Clean-up and start generating insights, finding meaning, and supporting your goal.
- Analyze and present findings
Next, you will examine the clean data with reference to your objectives. Again, think about the objective that you identified in step 1. How can you approach the potentially large cleansed data set and identify meaning? How can you break the data down further? Are there geographic elements that you can explore? How about year-on-year trends? It’s through this process of refinement and exploration that you will find meaning and derive insights to meet your goals. You then need to effectively communicate insights to stakeholders so that action can be taken. Perhaps sending links to spreadsheets will suffice, or you may wish to convert data into graphs and charts. Maybe go one step further with infographics. Either way, ensure that the insights are clear, concise, easy to read, and easy to develop into action points.
- Repeat the process
Data analytics is an ever-growing and constant process. Once you’ve discovered insights, once you’ve made plans, once you’ve defined your strategy or changed your approach, you need to start again. Perhaps you will build on the previous insights, or maybe the insights did not lead you where you wanted. Perhaps you are taking on an entirely different task. Either way, data analytics is ongoing – and successful organizations should always end at the beginning.

Now that you understand the basics of data analytics, check back soon for our next article on “How to become a massive data nerd”.

